Blueback Investigator
Understand, analyze and visualize cross-domain data.
Blueback Investigator provides a rich data analysis experience and enables more workflows for the user.
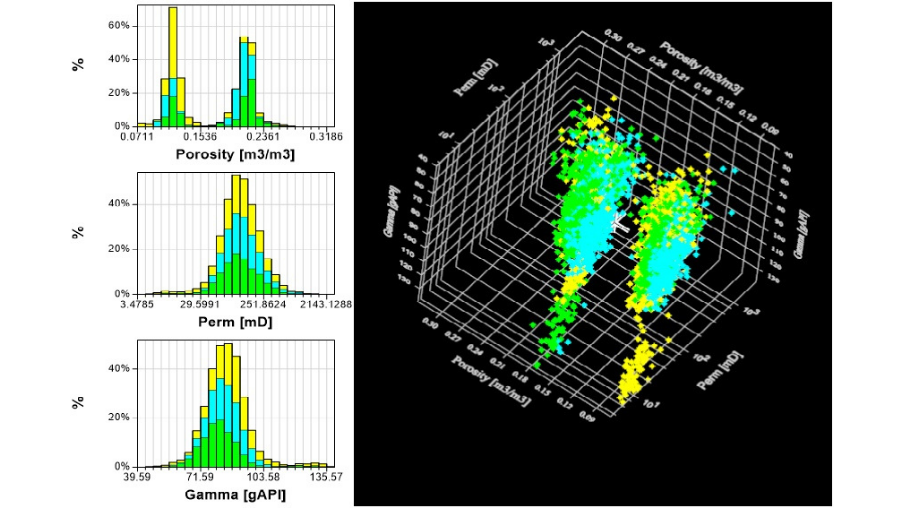
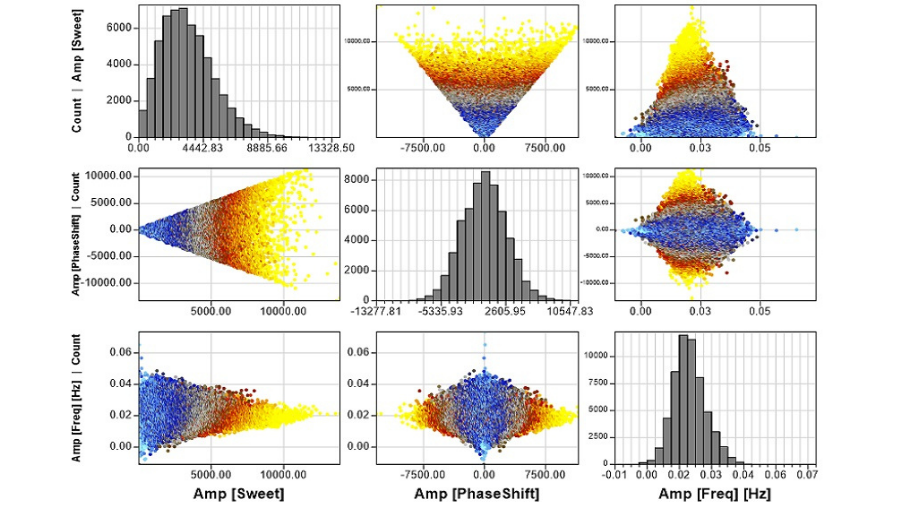
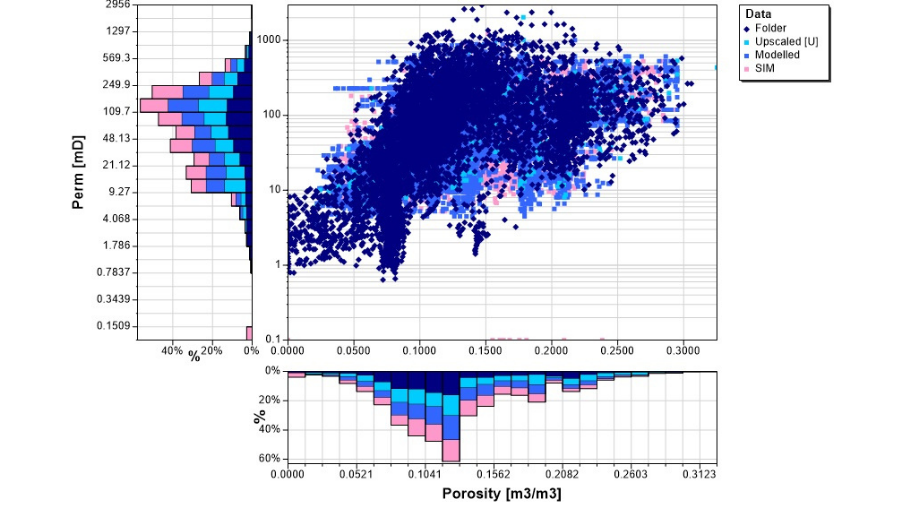
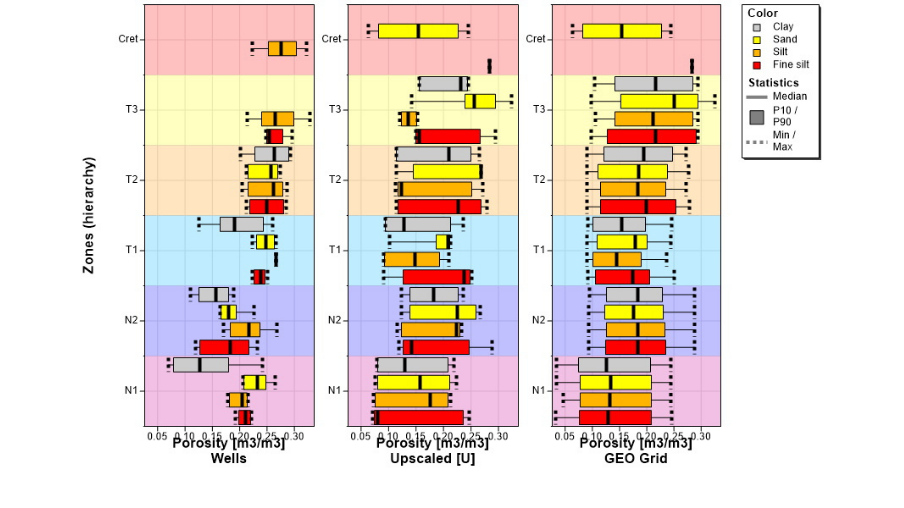
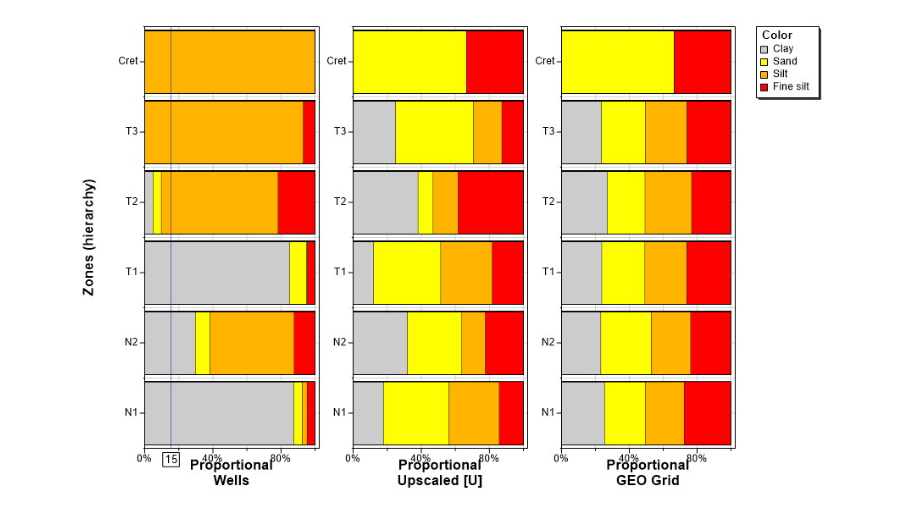
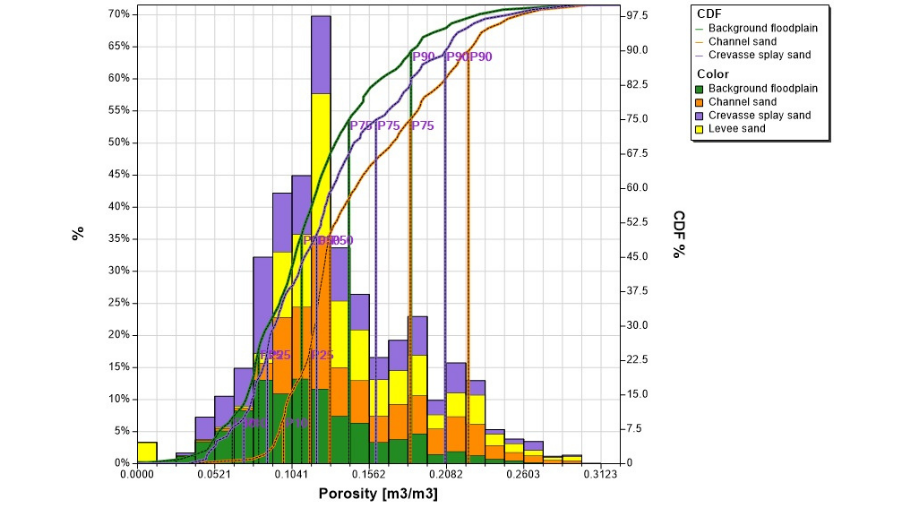
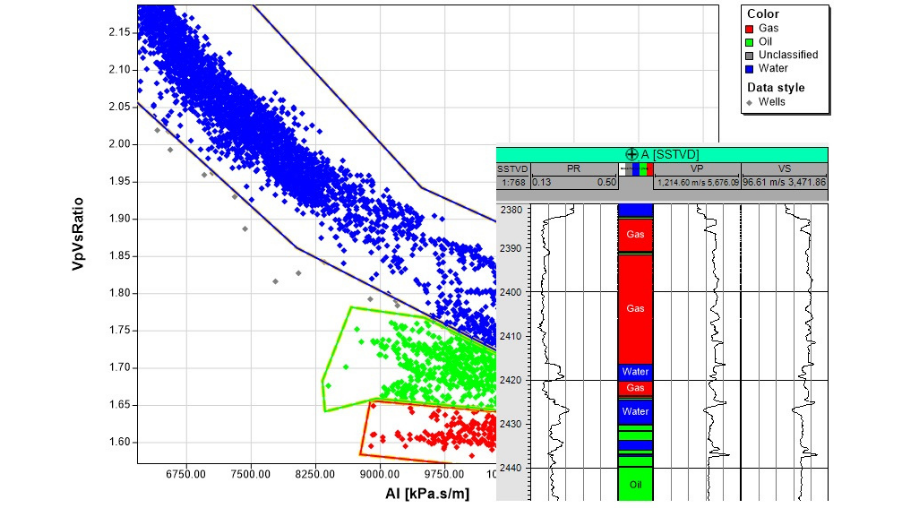
Dedicated histogram, crossplot, matrix, parallel coordinates and 3D plot windows provide tools to visualize your data.
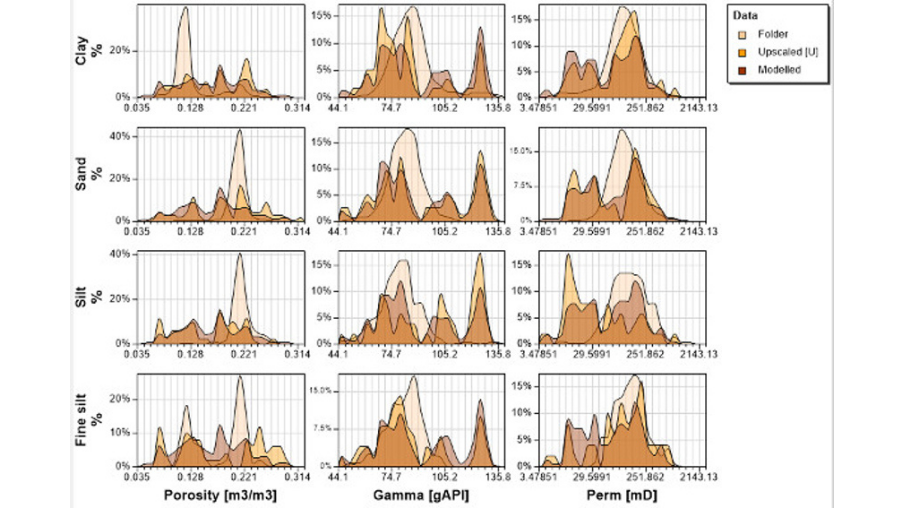
Identify trends in the data and use these to generate new properties.
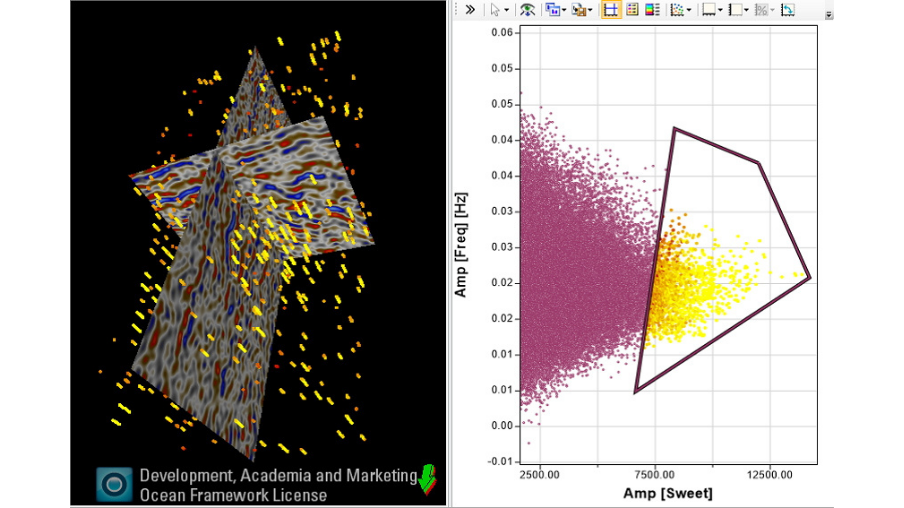
Benefit from a rich selection of controls for managing plot appearance, annotations, filtering and creating equations for data correlation.
Blueback Investigator introduces a much richer data analysis and visualization experience for Petrel users.