Novel approach to data handling in spectral decomposition with Cegal Blueback Avary
Spectral decomposition is an effective technique to highlight subtle geological features. Calculating and combining a large number of possible volumes has always been a burden. This aspect has been greatly simplified thanks to the new architecture in Cegal Blueback Avary.
Transforming seismic data into the frequency domain allows localizing thin bed reflections and to define variability of bed thickness embedded within rock stratigraphy. This technique allows geophysicists to visualize the content of frequency in seismic data along a time axis. Individual spectral decomposed volumes at their specific single frequencies are usually combined for display using a color-blending technique, like for example RGB (red-blue-green). In this technique, the interpreter selects three discrete frequency volumes out of many and plots them against red, blue, and green.
This method presents a great challenge, as the interpreter must usually first calculate a series of seismic volumes to cover the range of frequencies characteristic of the seismic data, and then begin to combine which volumes and their corresponding frequencies tune best and highlight the geological features.
This is where the new Cegal Blueback Avary architecture allows the interpreter to have dynamic and interactive handling of all frequency volumes when searching for the best possible frequency combination. It is no longer necessary to generate large volumes on the disk, on the contrary, the interpreter can spend much more time visualizing and analyzing the data.
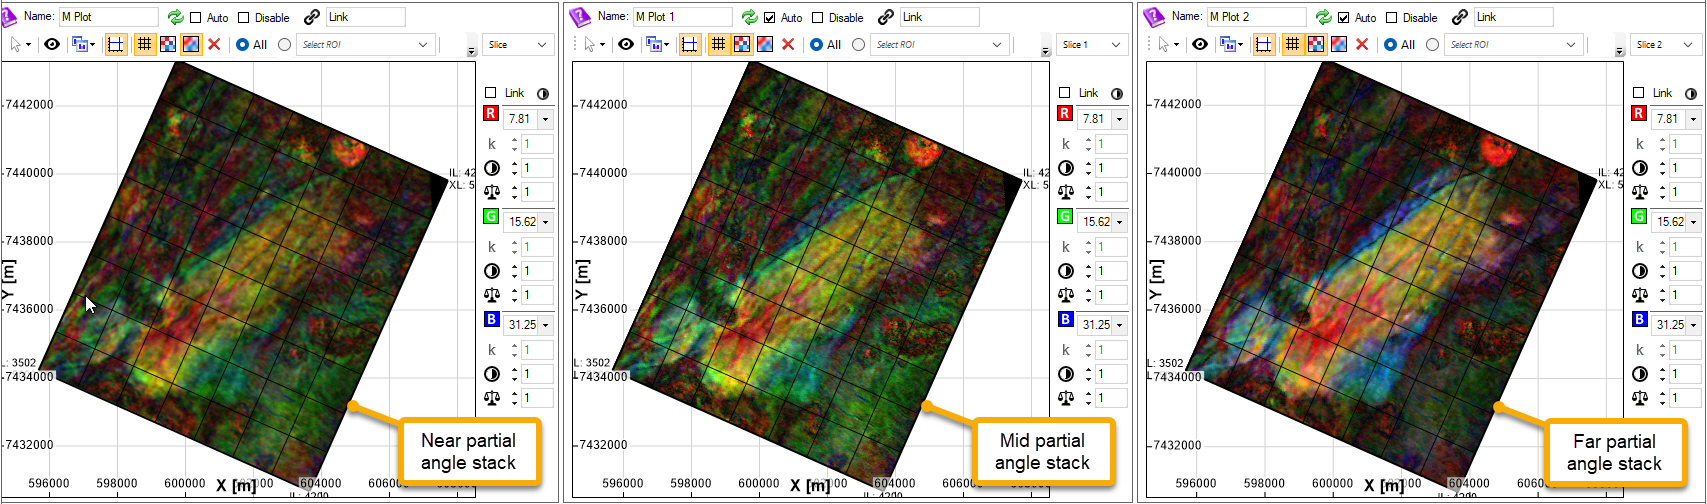
Fig. 1: Slice display of spectral decomposition of near-mid and far partial angle stack
The example in the image above shows three combined plots of near-mid- and far partial-angle stacks, with an RGB combination of 7.8, 15.6, and 31 Hz respectively. The frequencies to be RGB-mapped have been selected out of a series of 8 frequency ranges computed using a Continuous Wavelet Transform method. This would mean a total of 24 volumes on the disk, however, with Avary, all computations are done in virtual mode.
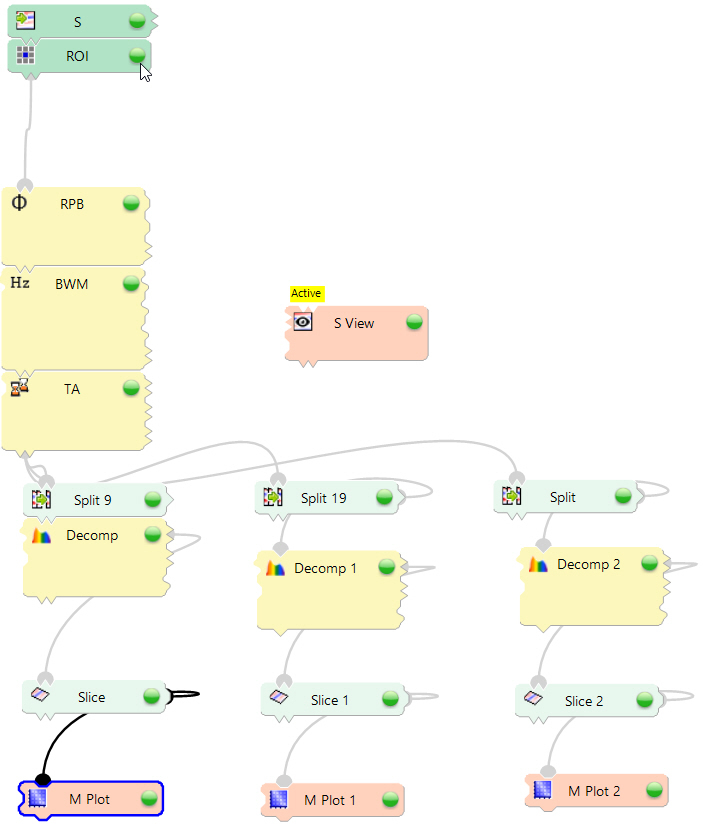
Fig. 2: Avary workflow with pre-conditioning prior to the spectral decomposition
Additionally, several other processes prior to the calculation of frequencies for spectral decomposition can be applied to the data. The example in the image above shows a chain of processes to pre-condition the partial stacks around phase, bandwidth, and vertical alignment. This means that by adjusting any parameters in these processes, the user can dynamically evaluate the impact on the spectral decomposition results.